


Conversion Rate Optimization (CRO): A Practical Guide for India
The formula, honest benchmarks, A/B test maths in plain English and India-specific fixes to turn the traffic you already pay for into more leads and sales.


The formula, honest benchmarks, A/B test maths in plain English and India-specific fixes to turn the traffic you already pay for into more leads and sales.
01Conversion rate optimization (CRO) raises the share of existing visitors who buy, book or enquire, using research and controlled tests instead of opinions.
02The Unbounce Conversion Benchmark Report 2024 puts the median landing page conversion rate at 6.6%, but your own segmented history is the only benchmark that matters.
03Microsoft Clarity is free and, combined with GA4 funnel explorations, shows both where and why visitors drop off.
04Google Optimize shut down on 30 September 2023, so A/B testing now needs a tool such as VWO, Optimizely or AB Tasty.
Conversion rate optimization (CRO) is the practice of getting a bigger share of your existing visitors to take the action you want: buy, book, call or fill a form. You do it by finding where people drop off, testing fixes, and keeping only the changes that move the number. It is the cheapest growth lever most Indian businesses ignore.
Ad costs rise every year. Your conversion rate is the one number that makes every rupee of Google, Meta and SEO traffic work harder. This guide gives you the formula, honest benchmarks, the full research-to-test process, A/B testing maths in plain English, India-specific fixes and a 30/60/90-day plan.
Conversion rate optimization is a structured process for increasing the percentage of website or app visitors who complete a goal, such as a purchase, lead form, demo booking or WhatsApp chat. It combines analytics, user behaviour research and controlled experiments, so decisions come from evidence rather than the loudest opinion in the room.
CRO is not “make the button orange”. It is a loop: measure, understand why people leave, form a hypothesis, test it, learn, repeat. A single winning test is nice. A team that runs the loop every month compounds.
A conversion can be a macro goal (an order, a paid signup) or a micro goal (add to cart, newsletter signup, click to WhatsApp). Track both. Micro conversions tell you where the funnel leaks long before revenue shows it.
Conversion rate equals conversions divided by total visitors (or sessions), multiplied by 100. If 12,000 people visit your landing page in a month and 360 submit the form, your conversion rate is 360 ÷ 12,000 × 100 = 3%. Always state which denominator you used, because users and sessions give different answers.
The formula is simple. The definitions are where teams fight. Decide these three things before you start:
Two related formulas matter just as much. Revenue per visitor (revenue ÷ visitors) stops you from “winning” a test that raises orders but cuts order value. Cost per acquisition (ad spend ÷ conversions) shows the business impact: double your conversion rate at the same spend and your cost per acquisition halves.

A good conversion rate is one that beats your own previous rate for the same traffic, offer and device. Published benchmarks give a rough reference: the Unbounce Conversion Benchmark Report (2024) puts the median landing page conversion rate across industries at 6.6%. Treat that as context, not a target.
Unbounce’s report analysed over 41,000 landing pages, more than 464 million visitors and over 57 million conversions. Even inside that dataset, the nine highlighted industries ranged from 3.8% to 12.3%. That spread is the first reason averages mislead.
Here is why you should never panic, or celebrate, over a benchmark:
The useful benchmark is internal. Segment your conversion rate by channel, device and landing page, then improve the worst large segment first.
The CRO process works in six repeating stages: set up clean tracking, research where and why visitors drop off, write evidence-based hypotheses, prioritise them with a scoring model such as ICE or PIE, run controlled tests, and document what you learned. Skipping research is the most common reason tests fail.
If your tracking is wrong, every test result is wrong. Check that each key event fires once, with the right value, on every device. Compare GA4 orders with your payment gateway or CRM for the same week. A gap above a few percent means fix tracking before you test anything. Our GA4 guide covers events and key event setup, and this piece on conversion tracking for PPC campaigns covers the ad side.
Quantitative data tells you where people leave. In GA4, go to Explore and pick the Funnel exploration template. Google’s help page says a funnel can hold up to 10 steps, each defined by events or dimension values.
Qualitative data tells you why. Microsoft Clarity is the obvious start for Indian SMBs because Microsoft describes it as “a free service forever” on its Clarity documentation. The Clarity pricing page also calls it a free user behaviour analytics tool.
Clarity gives you click maps, scroll maps, area maps and conversion maps, plus session recordings of individual visitor journeys. Watch 20 to 30 recordings of people who reached the leaking step and left. Note every hesitation, repeated tap, scroll back and form field abandoned. One rule: Microsoft says Clarity should not be used on sites or apps that target users under 18.
Add two cheap research sources on top:
A hypothesis links evidence to a change and a predicted result. Use this template: “Because we saw [evidence], we believe [change] for [audience] will cause [metric] to move. We will know when [measurement].”
Example: “Because 38 of 50 mobile recordings show users scrolling back up to find delivery dates, we believe showing the delivery estimate next to the price on mobile product pages will raise add-to-cart rate.” Bad hypotheses start with “Let’s try”.
You will have more ideas than traffic. Score each idea and test the top of the list.
| Framework | Scores | Best for |
|---|---|---|
| ICE | Impact, Confidence, Ease (1 to 10 each) | Fast-moving teams with mixed ideas across pages |
| PIE | Potential, Importance, Ease (1 to 10 each) | Choosing which page or funnel step to work on first |
| Simple value vs effort | High or low on each axis | Founders running CRO alone with little data |
Average or multiply the scores. Be honest on Confidence: an idea backed by recordings and survey answers deserves a higher score than a competitor screenshot.
Run the top idea as an A/B test if you have the traffic, or as a before-and-after change with careful monitoring if you do not. Log every test in a shared sheet: hypothesis, dates, sample, result, decision and what you learned. Losing tests are useful. They tell you what your buyers do not care about.
Pro tip: Start CRO at the bottom of the funnel. A 10% lift on checkout or form submit reaches revenue directly, while a 10% lift on homepage clicks may never show up in sales.
An A/B test should run until it reaches the sample size you calculated before launch, and for at least one full business cycle of seven days so weekday and weekend behaviour are both included. Optimizely recommends a minimum of one business cycle. For most Indian SMB pages, that means two to six weeks.
A/B testing splits traffic between version A (control) and version B (variant) at the same time, so seasonality and ad changes hit both equally. The statistics are less scary than they look. You need four inputs, the same ones Evan Miller’s free sample size calculator asks for:
Optimizely defines statistical significance as the likelihood that the difference between variation and baseline is not due to chance. In plain English: a “significant” result means your winner is probably real, not a lucky week.
PingTalks ran the standard two-proportion formula at 95% significance and 80% power for common cases. These are visitors needed per variation.
| Baseline rate | Lift to detect (relative) | Visitors per variation | Days at 1,000 visitors a day (2 variations) |
|---|---|---|---|
| 3% | 20% (3.0% to 3.6%) | About 13,900 | About 28 |
| 3% | 10% (3.0% to 3.3%) | About 53,200 | About 106 |
| 5% | 20% (5.0% to 6.0%) | About 8,200 | About 17 |
The duration maths follows Optimizely’s method: sample size multiplied by the number of variations, divided by average daily visitors. Notice the brutal part. Halving the lift you want to detect roughly quadruples the traffic you need.
Do not peek and stop. Optimizely notes that classical statistics require a sample size fixed in advance. Stopping the moment a variant looks ahead inflates false winners. Decide the sample and the end date before launch, unless your tool uses sequential statistics built for continuous monitoring.
Low traffic? Test bigger, bolder changes (a new offer, a rewritten hero, removing a checkout step) so the effect is large enough to detect. Or skip formal testing and use research-backed changes with a before-and-after check. Small button-colour tests on 3,000 visitors a month are a waste of a quarter.
A landing page converts when it matches the promise of the ad or search result, states a clear offer in the first screen, proves it with specific evidence, removes doubt about price and delivery, and asks for one action. Every element that does not support that single action is a leak.
Use this anatomy checklist on every paid landing page before you spend another rupee on traffic:
If your paid campaigns already get clicks but few leads, the landing page is usually the culprit. The Google Ads guide and Meta Ads guide cover the traffic side.
You reduce form and checkout drop-off by asking for fewer fields, showing the full cost early, allowing guest checkout, offering the payment methods your buyers trust, and fixing errors that block submission. Baymard Institute’s research puts the average documented cart abandonment rate at 70.22%, so checkout is where most money leaks.
Baymard’s survey of reasons for abandonment (excluding people who were just browsing) is the best checklist you will find. Here are the top reasons with the fix for each:
| Reason shoppers gave | Share | Fix to test |
|---|---|---|
| Extra costs (shipping, tax, fees) too high | 40% | Show delivery charges on the product page, or price shipping into the product |
| Delivery too slow | 20% | Show a PIN code based delivery date before checkout |
| Did not trust the site with card details | 19% | Recognisable payment logos, secure checkout messaging, visible company details |
| Site wanted an account | 18% | Guest checkout or phone number plus OTP login |
| Checkout too long or complicated | 17% | Cut fields, autofill city and state from PIN code |
| Website errors or crashes | 17% | Watch Clarity recordings of the checkout step weekly |
| Too few payment methods | 9% | Add UPI, cards, net banking, wallets and COD where viable |
For lead forms, the same logic applies. Every field must earn its place.
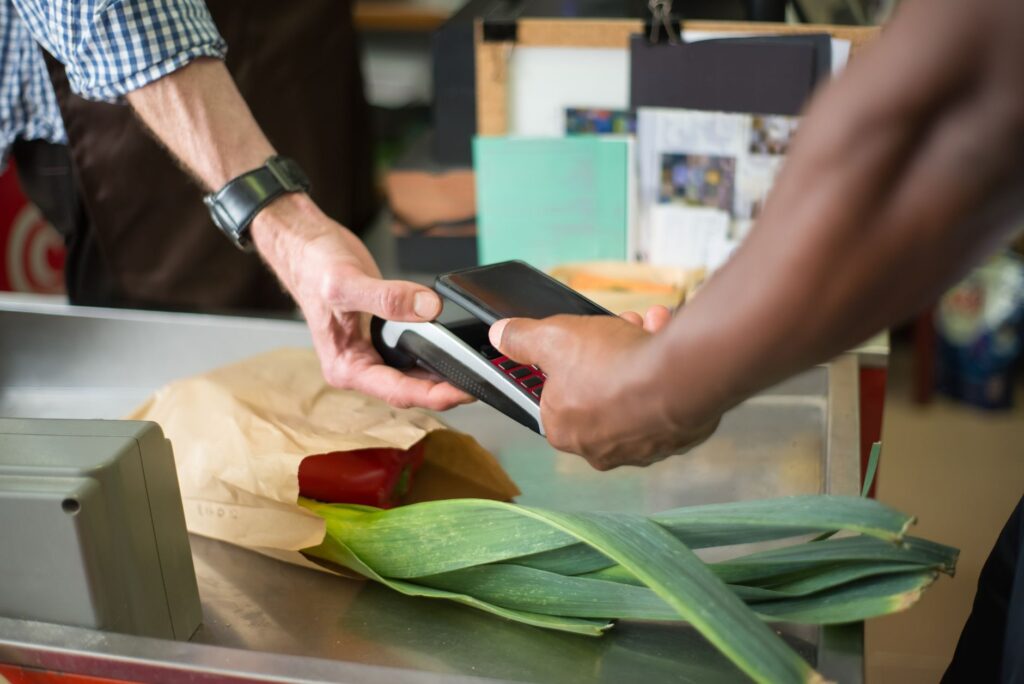
Indian buyers bring specific friction points: distrust of new websites, a strong habit of paying by UPI or cash on delivery, an expectation of instant WhatsApp answers, sensitivity to hidden delivery charges, and comfort with regional languages. Global CRO playbooks miss most of these, so Indian sites must design for them deliberately.
COD lowers the buyer’s risk and raises yours, because refused parcels cost you shipping both ways. Do not remove COD blindly. Test these instead:
For most Indian shoppers on a phone, UPI is the fastest way to pay. Put it at the top of the payment list on mobile, launch the UPI app directly from the button where your gateway supports it, and show a QR code on desktop so buyers can pay with their phone. Test payment method order: it costs nothing and often moves numbers.
Many Indian buyers will message before they buy. A floating WhatsApp button on product and pricing pages captures people who would never fill a form. Meta’s WhatsApp Cloud API documentation lists use cases including order confirmations, shipping updates, interactive messages and end-to-end transactions from product discovery to payment. Our WhatsApp marketing and Business API guide explains setup, and this piece on chatbots and live chat for lead generation covers automation.
If a large share of your buyers are in Tier 2 and Tier 3 cities, test a Hindi or regional language version of your top landing page, or at least key trust lines and the CTA. Match the language of the ad to the language of the page. Hindi ad, English page is a guaranteed leak.
In India, trust is the conversion rate. Every doubt you answer on the page is a sale you stop losing to COD refusals and unanswered WhatsApps.
You optimise conversions on mobile by designing for a thumb, a small screen and a patchy connection: put the offer and CTA in the first screen, use sticky add-to-cart or WhatsApp buttons, shorten forms, enable autofill and UPI, and test on mid-range Android phones on 4G rather than a fast office laptop.
Mobile is where most of your traffic lives. Unbounce’s data showed 83% of landing page visits came from mobile, while desktop still converted slightly better. That gap is your opportunity.
Yes. Faster pages convert better, and Google’s web.dev team documents it with real A/B tests. In Vodafone’s case study, a 31% improvement in Largest Contentful Paint produced 8% more sales, a 15% higher lead-to-visit rate and an 11% higher cart-to-visit rate, with everything else on the page kept identical.
The Vodafone case study is useful because it was a proper split test: paid traffic split 50/50 between two visually identical pages, one with web vitals fixes such as server-rendered critical HTML and optimised images. LCP went from 8.3 seconds to 5.7 seconds.

There is an Indian example too. The redBus case study on web.dev reports that cutting search result fetches from 30 to 10 per lazy-load call brought Interaction to Next Paint down from roughly 870 to 900 to 350 to 370, and sales rose about 7% overall. web.dev’s why speed matters page also cites Rakuten 24, where Core Web Vitals work lifted conversion rate by 33.13% and revenue per visitor by 53.37%.
Use the targets from web.dev’s Core Web Vitals guide, measured at the 75th percentile of page loads, split by mobile and desktop:
| Metric | What it measures | Good threshold |
|---|---|---|
| Largest Contentful Paint (LCP) | Loading: when the main content appears | 2.5 seconds or less |
| Interaction to Next Paint (INP) | Responsiveness to taps and clicks | 200 milliseconds or less |
| Cumulative Layout Shift (CLS) | Visual stability, no jumping buttons | 0.1 or less |
Check any URL in PageSpeed Insights: paste the URL and click Analyze. Fix the largest image and render-blocking scripts on your top landing page first.
Most Indian businesses need only three tools to start CRO: Google Analytics 4 for funnels and key events, Microsoft Clarity for heatmaps and session recordings, and an A/B testing tool such as VWO, Optimizely or AB Tasty once traffic justifies it. Google Optimize no longer exists, so ignore old guides that recommend it.
Google discontinued Optimize and Optimize 360 on 30 September 2023, and any experiments still running stopped. Google’s sunset notice names AB Tasty, Optimizely and VWO as A/B testing partners that integrate with Google Analytics.
| Tool | What it does | Cost | Use it for |
|---|---|---|---|
| Google Analytics 4 | Funnel explorations, key events, segments | Free, per Google Marketing Platform | Finding where users drop off |
| Microsoft Clarity | Click, scroll, area and conversion maps, session recordings | Free, per Microsoft | Finding why users drop off |
| VWO | A/B testing and experimentation | Growth, Pro and Enterprise plans; price via demo request | Running controlled tests |
| Optimizely and AB Tasty | A/B testing and experimentation | Check with vendor | Larger testing programmes |
| PageSpeed Insights | Page speed analysis by URL | Open in browser, no setup | Spotting slow landing pages |
| Evan Miller calculator | A/B test sample size | Free web page | Planning test length |
Do not buy an enterprise testing suite before you have a research habit and enough traffic. Clarity plus GA4 will find more money in your first month than any paid tool.

The CRO mistakes that waste the most time are testing without research, stopping tests early, testing tiny changes on low traffic, ignoring mobile and segment data, measuring the wrong goal, and copying competitors without evidence. Each one produces confident-looking results that do not hold up in revenue.
If you need a broader health check first, run our DIY website audit, then come back to this process.
This plan suits an Indian SMB or D2C brand with one marketer and a developer for a few hours a week.
Conversion rate optimization is the highest-return work most Indian marketing teams are not doing. Start free with GA4 and Microsoft Clarity, fix trust and checkout friction before running fancy tests, and only buy a testing tool once you have the traffic to reach a sample size in under six weeks. One honest, logged test a month beats ten random tweaks.
CRO touches every channel. These PingTalks guides take each part further:
SEO brings more visitors from search engines. CRO turns a bigger share of those visitors, and paid visitors, into customers. The two work together: more traffic is worth more when the page converts well.
It depends on your baseline rate and the lift you want to detect. At a 3% baseline and a 20% relative lift, the standard formula at 95% significance and 80% power needs roughly 13,900 visitors per variation. With less traffic, test bigger changes or use research-led fixes.
Yes. Microsoft describes Clarity as a free service forever with no obligation to upgrade. It includes heatmaps and session recordings, but Microsoft says it should not be used on sites that target users under 18.
Google discontinued Optimize on 30 September 2023 and did not launch a direct replacement. Its sunset notice points users to third-party testing tools that integrate with Google Analytics, naming AB Tasty, Optimizely and VWO.
Usually not. Removing COD can cut orders from buyers who do not yet trust you. Test prepaid incentives, WhatsApp order confirmation for COD and PIN code based COD limits instead.
Fixes to obvious problems such as broken forms, hidden delivery charges or slow pages can show results within weeks. A disciplined testing programme usually takes two to three months to produce reliable, repeatable wins.

Digital Evangelist and Entrepreneur at Clickseek Digital. A results-oriented marketing leader with an 18+ year track record driving transformative growth for diverse global businesses. Expert in performance marketing, demand generation, customer acquisition, strategic partnerships, and market expansion within B2B SaaS, Consumer-Tech, Fintech, Travel/Hospitality, and CRM/ITES Solutions sectors. IIM alumnus with a strong analytical background and a string of accolades, including "Top 50 Most Influential E-Commerce Professional of India" and "Top 100 Digital Marketer of India."



What changed in marketing and AI, why it matters and exactly what to do. In your inbox at 11:00 IST.